The "Analytics" subsystem provides the formation of complex analytical reports on corporate databases and has flexible tools for graphical presentation of the analyzed information. The work of the "Analytics" subsystem does not depend on the used DBMS with which the information system works - PostgreSQL, Oracle and MS SQL. The main difference between the "Analytics" subsystem and similar products is the ability for a user of any level to work in the subsystem, since the user does not operate with database fields and tables, but sees familiar concepts of his subject area written in Russian.
The administrator sets up the database, according to a certain rule, so that users of the "Analytics" subsystem can work with the concepts of the subject area familiar to them.
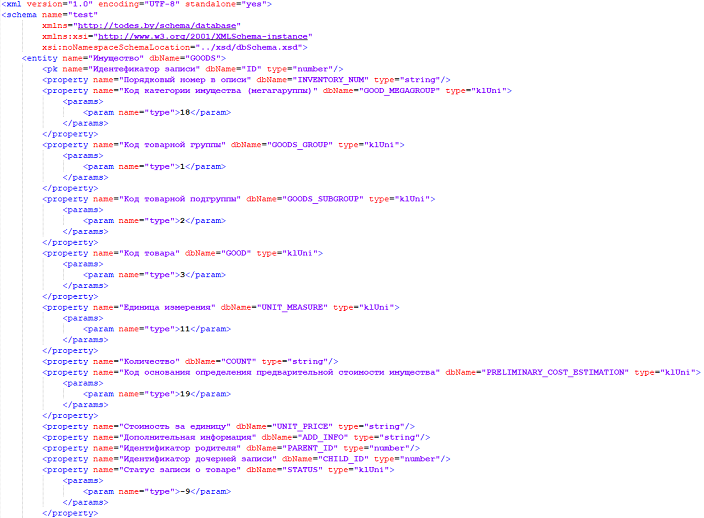
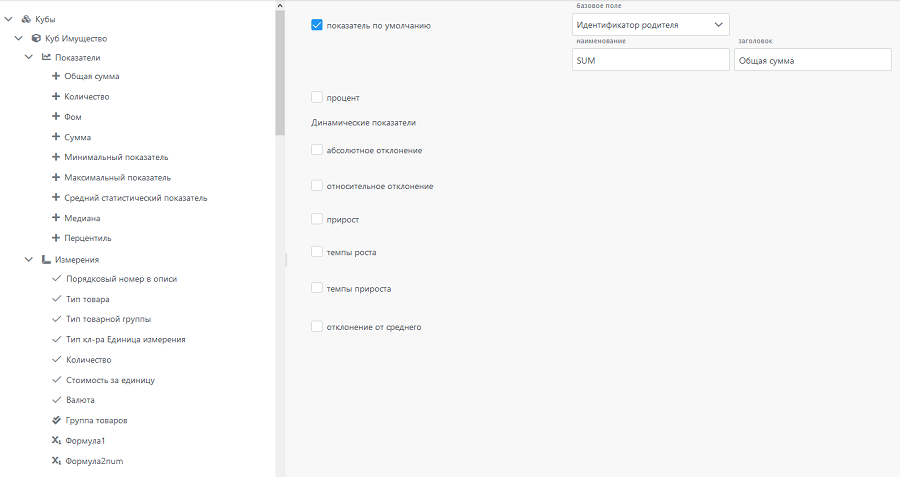
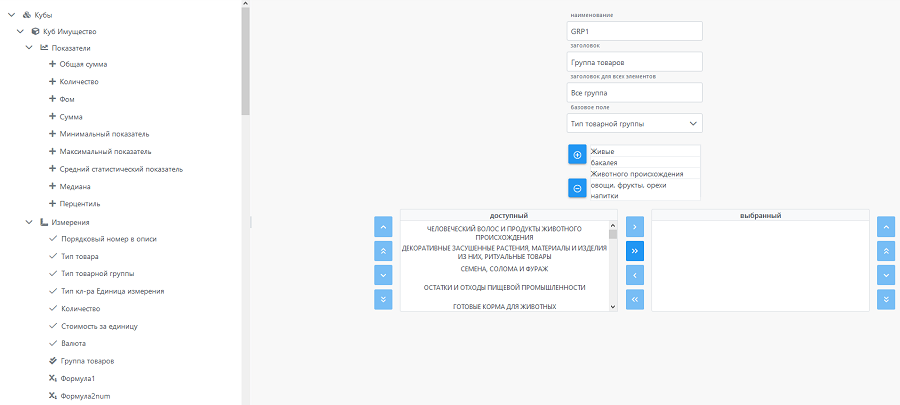
Based on the generated database, the user creates an analytical cube by selecting the necessary blocks of data, indicators and categories.
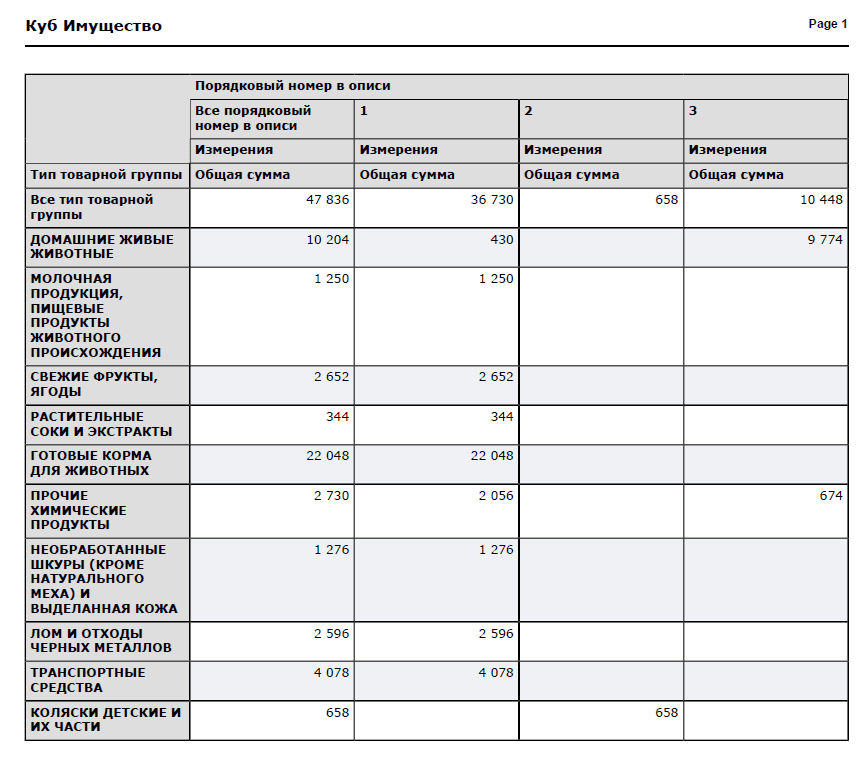
The user selects the generated analytical cube and creates an interactive report by dragging data from the "Cube Structure" block to the "Pivot Table Structure" block.
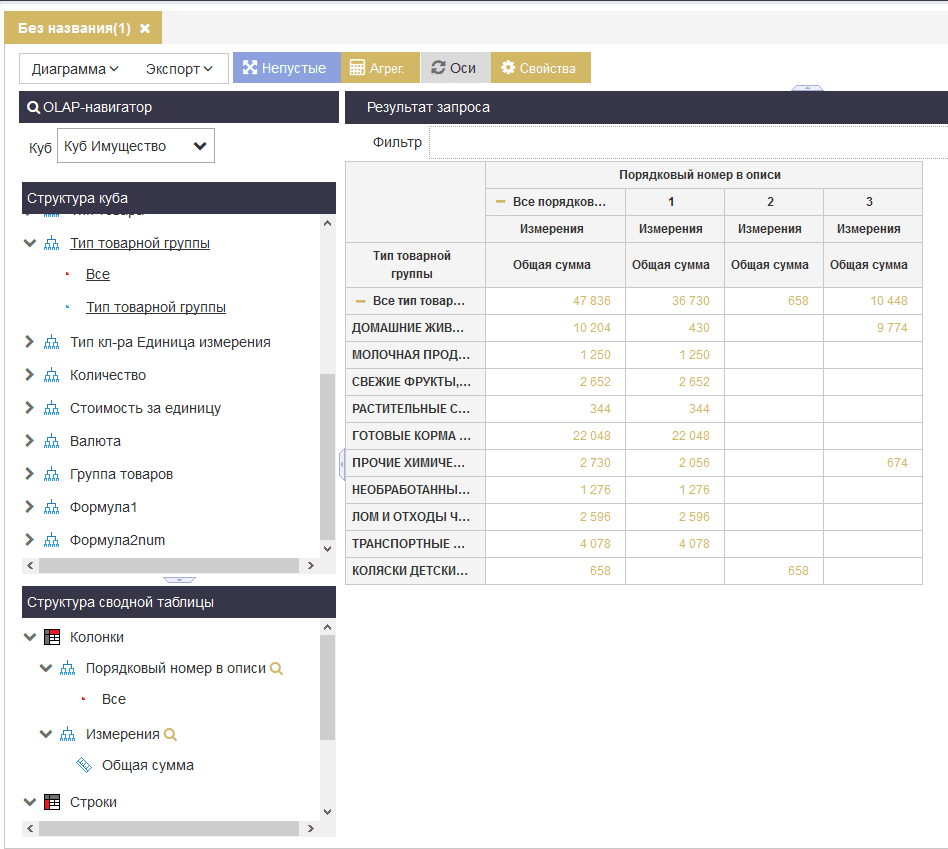
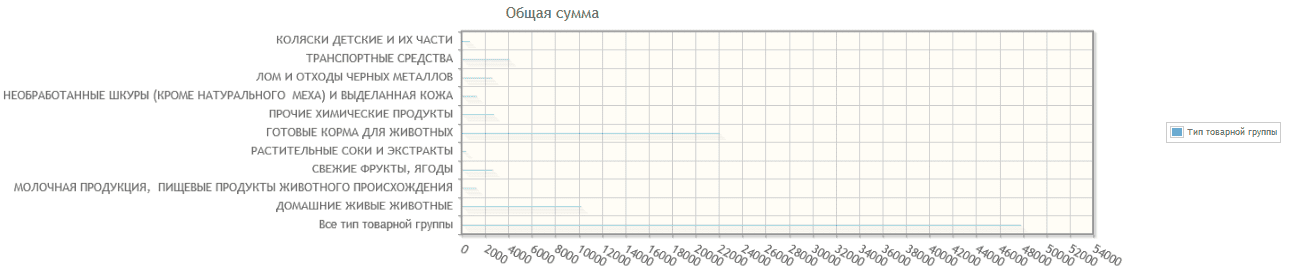
The generated report can be presented in any type of data visualization:
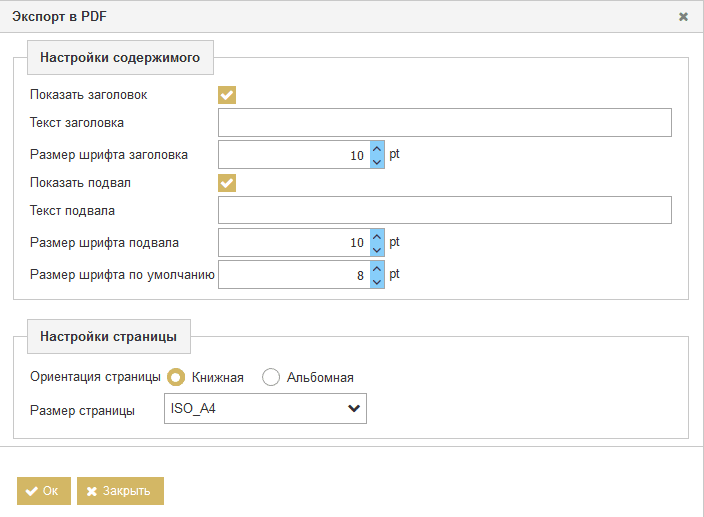
The user can download the generated report in a format convenient for him: .xls, .xlsx, .pdf.